
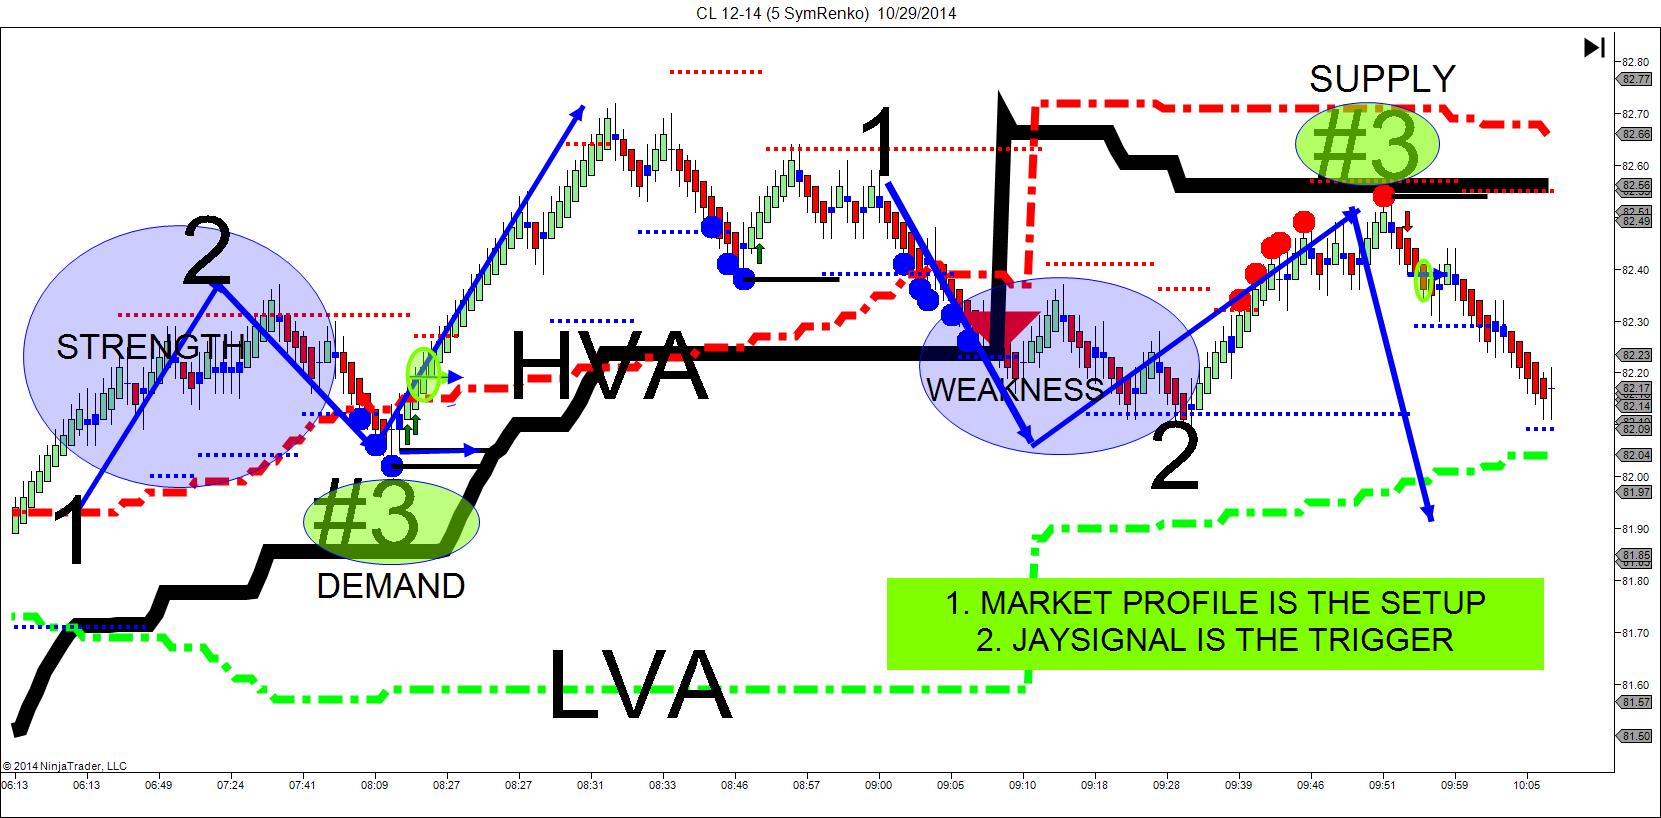
JaySignal combined with the Sym Renko bar type can show this imbalance using the following simple technique.
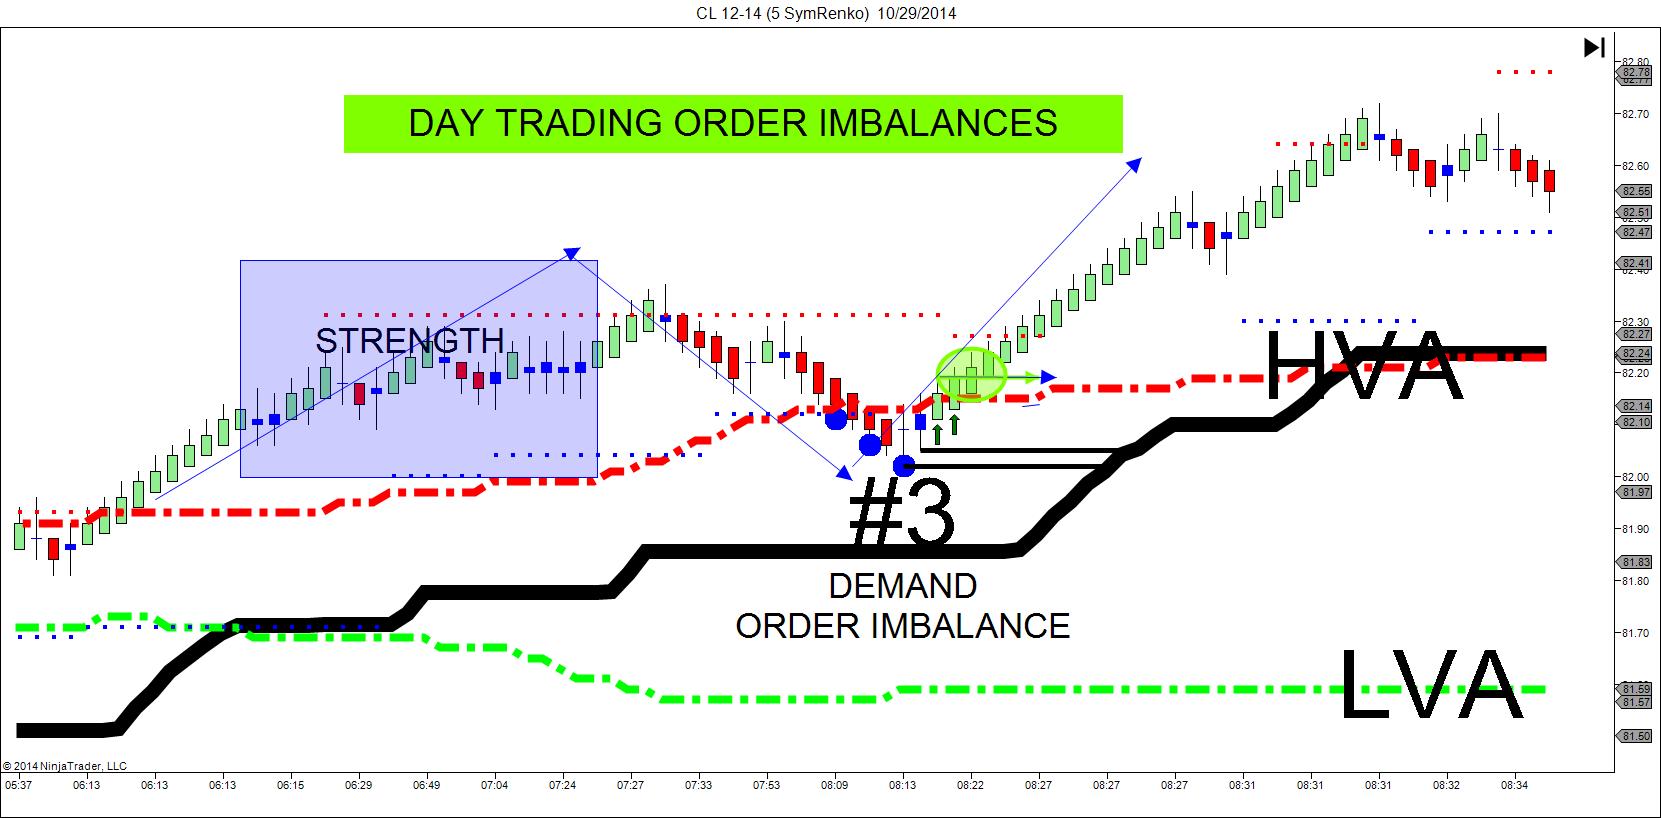
Most traders think we can't truly quantify supply and demand. I argue that we can quantify supply and demand by looking at a renko price bar chart and know the exact renko bar on a closing basis where an order imbalance can take place thus giving us the edge in the markets to give us the best reward to risk per trade.
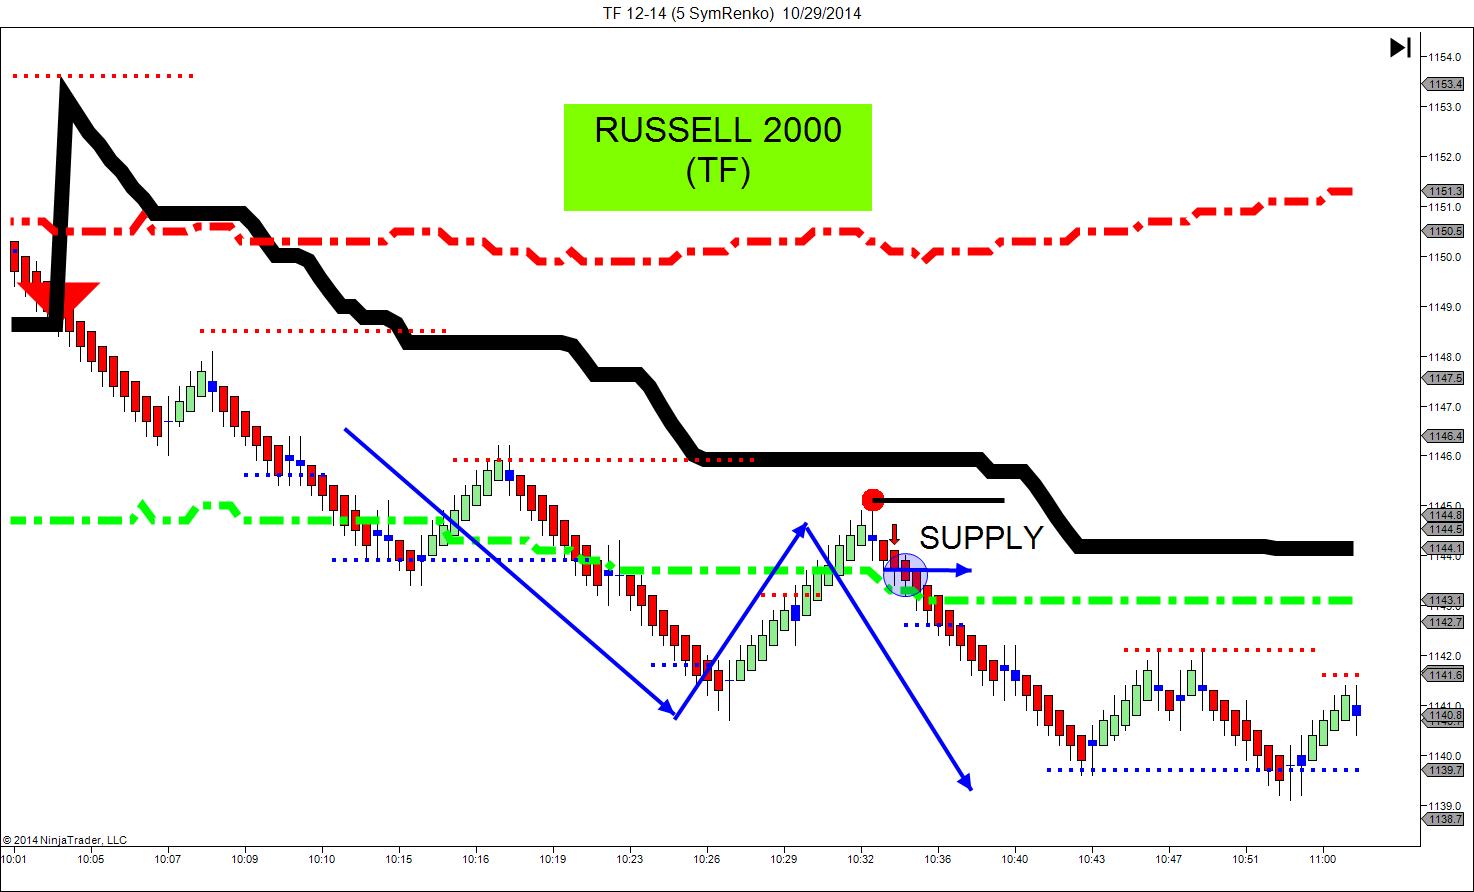
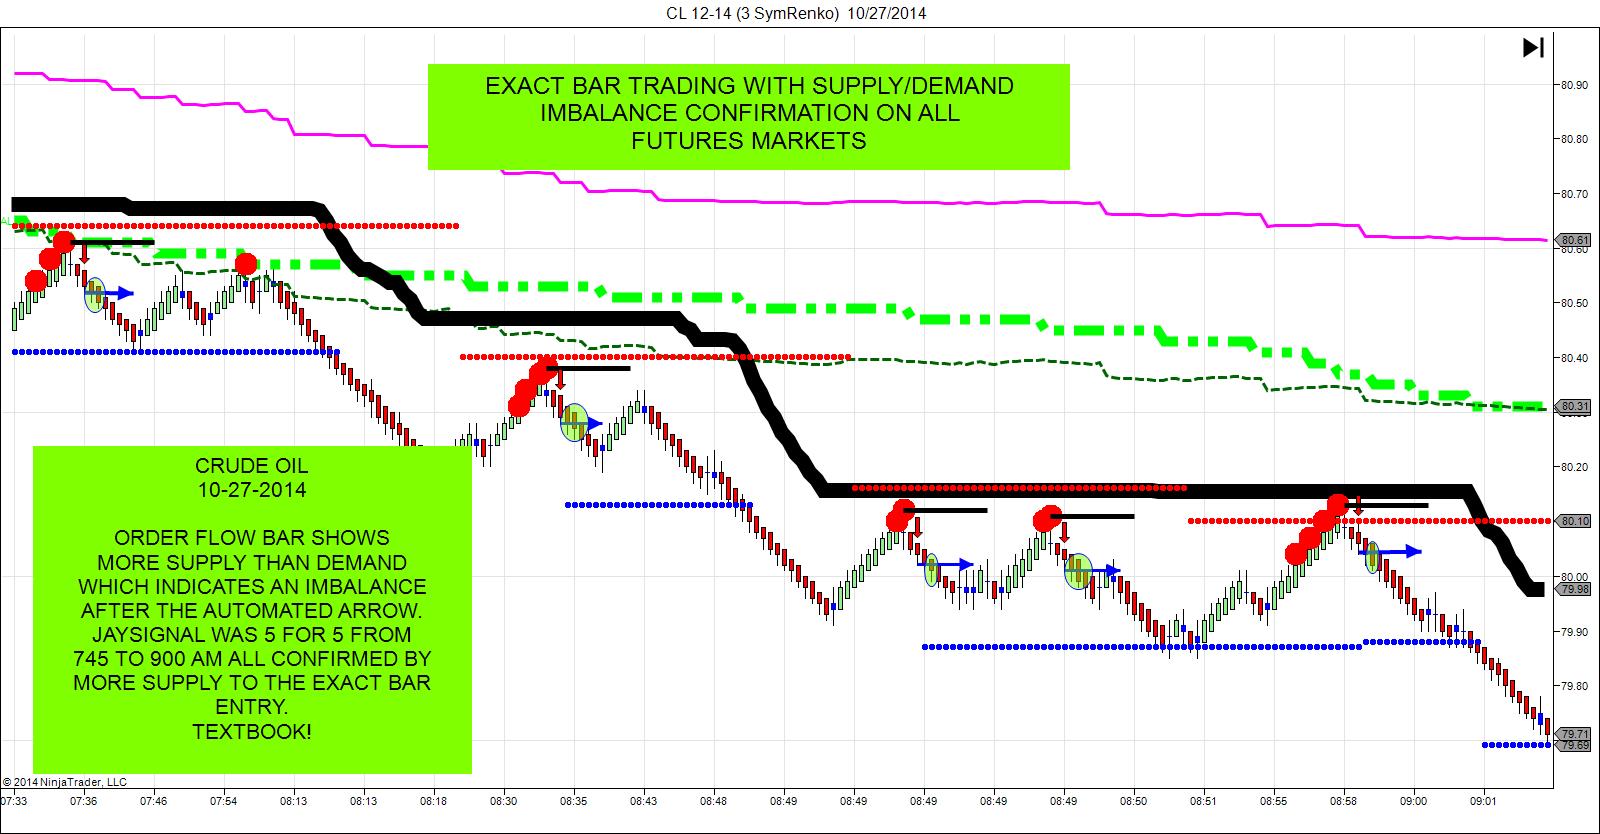
In fact, I believe that the price charts represent all buyers and sellers. To quantify supply and demand on a price chart one must know the inflection point where an imbalance is likely to happen on a daily basis. This is what I call the "edge" over trading opponents. The stronger the move in price away from a price level of support/resistance, the more out of balance supply and demand is at the level. This to me creates the imbalance that we need as traders to stay out of the chop phase and position ourselves into the direction of the imbalance of orders. If the market wants to mark the market down then I want to be short, If the market want to mark the market up then I want to be long. It is as simple as that or what I like to call the "Order Flow Bar". This exact bar qualifies my setup that a possible imbalance of orders will drive price in the direction of the imbalance.
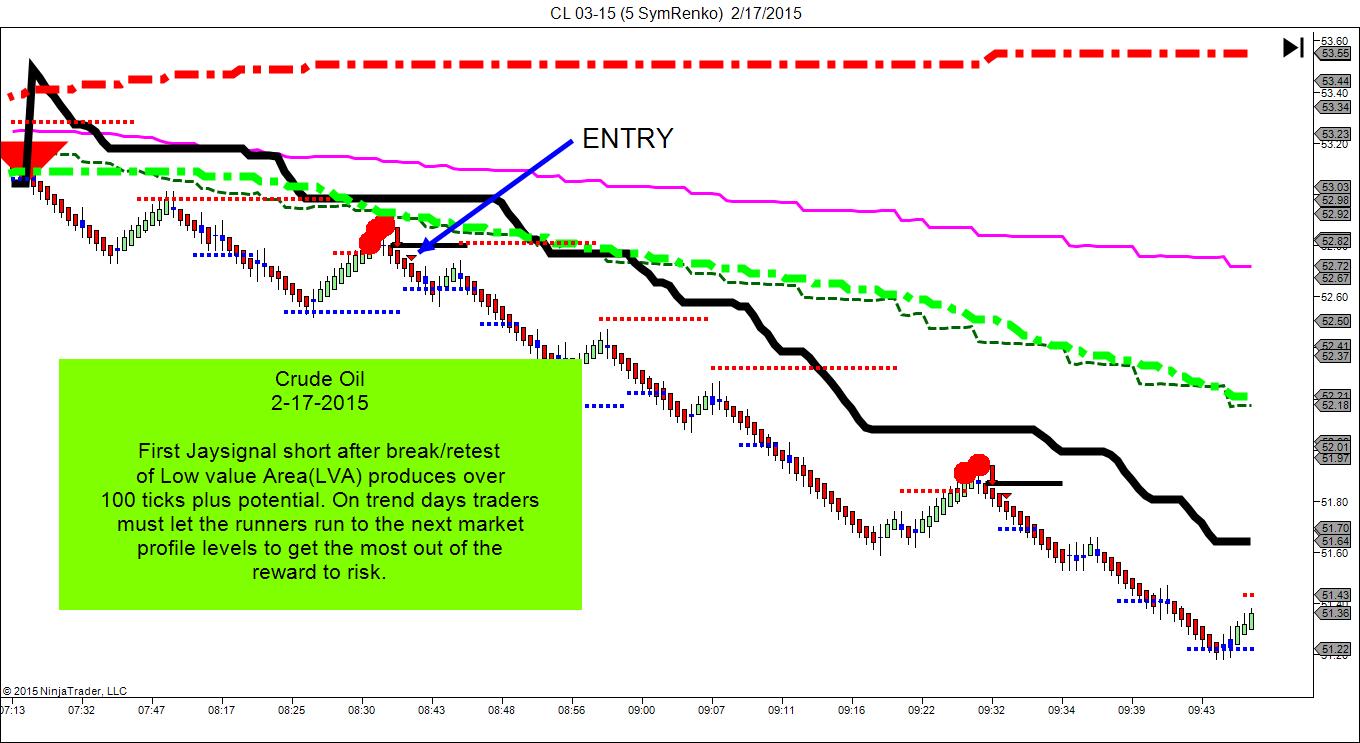
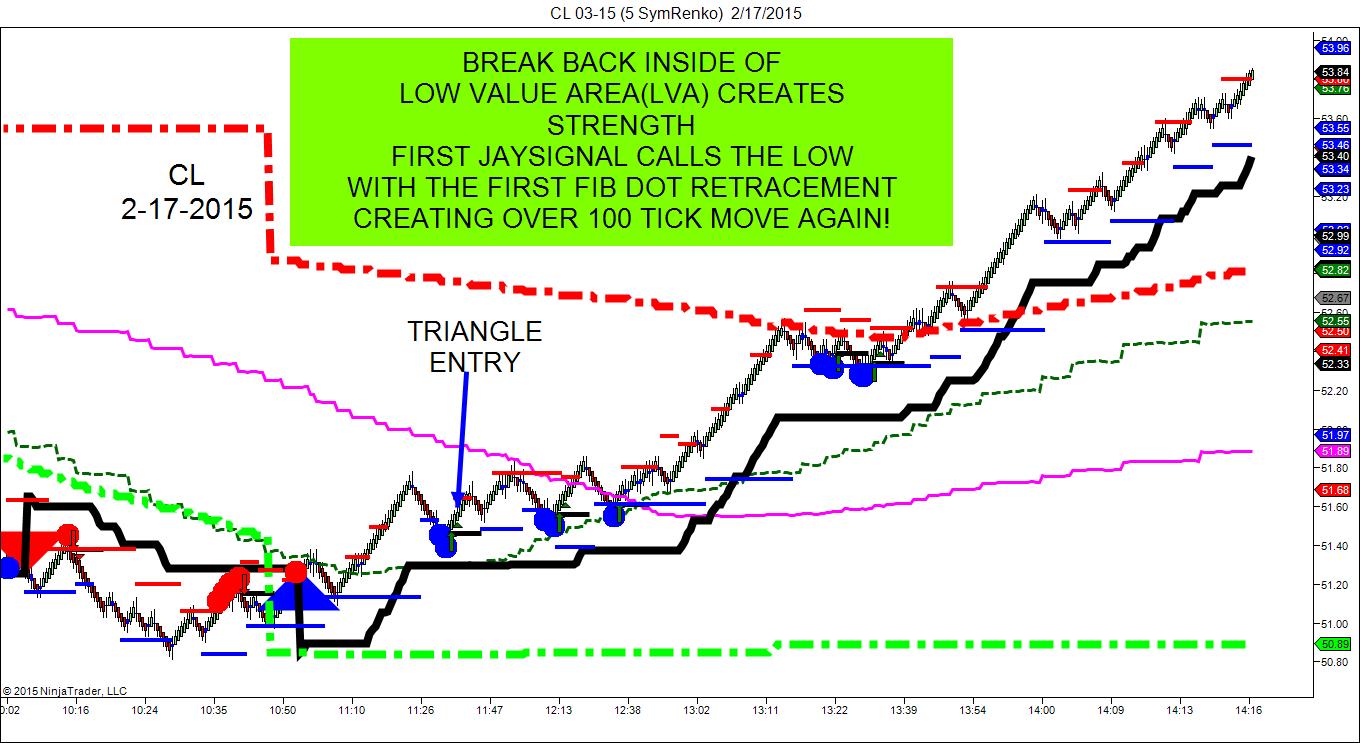
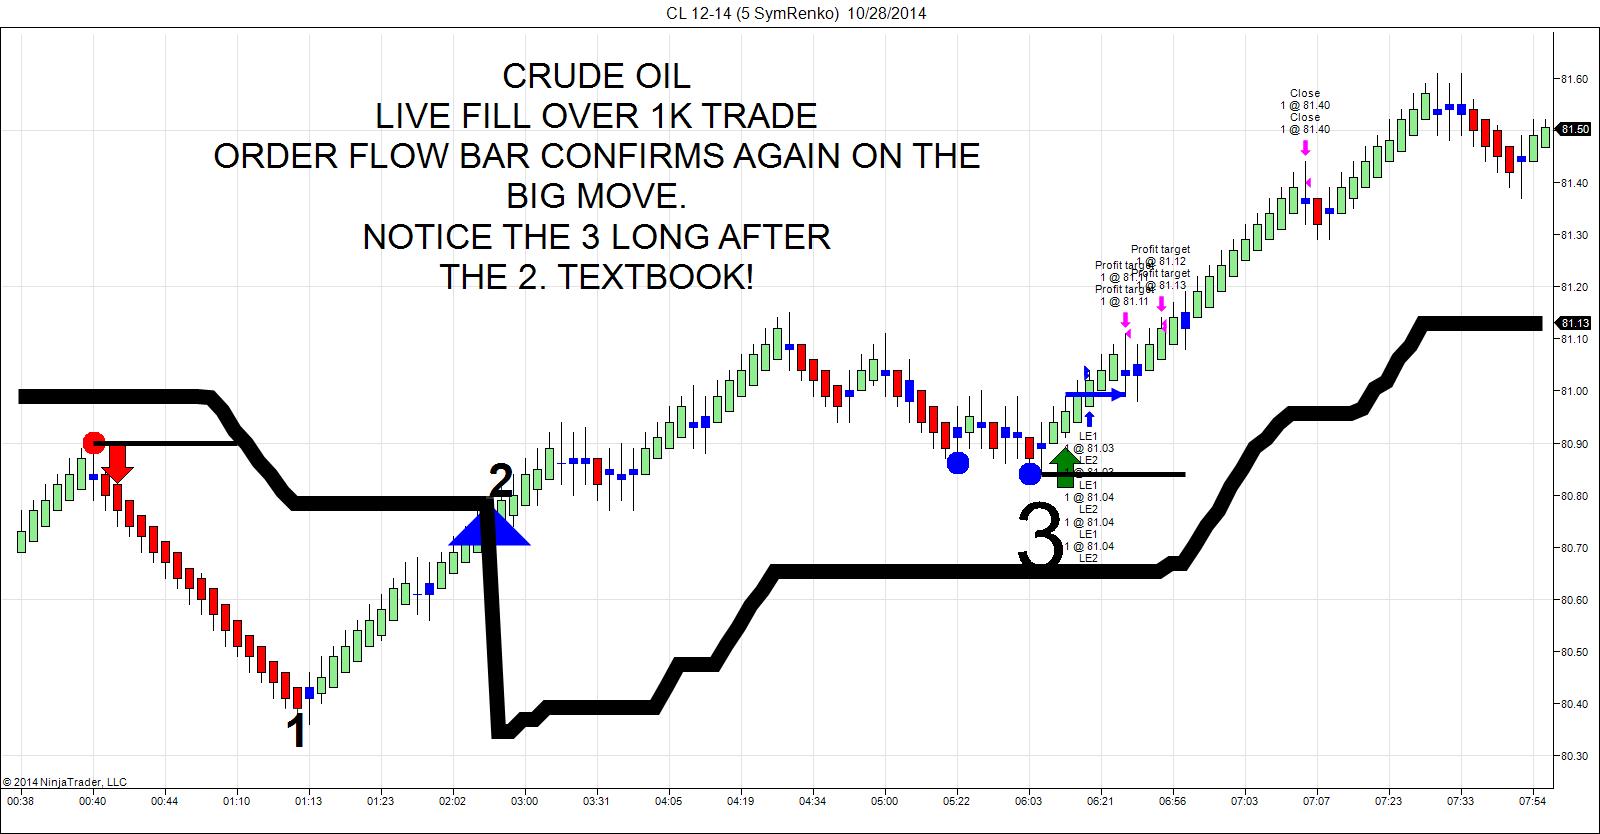
The Jaysignal is comprised of 3 important components. 1. Market Profile 2. Fibonacci Retracement Dots 3. Elliott Wave Patterns. Once these three phases all agree then it is time for the order flow bar. The order flow is much like market delta and is used to confirm that the setup after the automated arrow has fired that an imbalance of orders are going to occur or not going to occur. Meaning do we have a high probability setup or do we have a higher chance of a stop out. This edge is very important because not all setups will have order flow bar entries. In other words, the order flow bar allows the trader to cherry pick only the setups that have the high probability of an imbalance in the direction of the arrow. If an imbalance does not occur then the trader can sit and wait for the next setups thus reducing his or hers risk level.
It is as simple as waiting for an automated arrow on all markets with JaySignal and then waiting for a partial candle close of the 2nd bar after the arrow that closes below the low or above the high of that arrow. Don't make it any more difficult than that. The 2nd bar after the arrow tells the trader that yes/no the setup has order flow backing the short or long. If it does not then a lower probability trade is possibly occurring and the trade can be avoided or a small loss or profit can be taken. Traders that have been using this technique find that price reacts almost immediately in the direction of the signal thus creating high probability first target moves due to order flow. If waiting for the arrow and just entering off the order flow bar, traders can adjust stops to the high or low of the arrow bar or the previous bar before that on a closing basis. This gives the trader the ultimate edge with getting in on an order flow bar with small risk thus creating the edge daily. Remember, the order flow bar is great confirmation that the market is creating an imbalance of buyers vs sellers and this is exactly what we want.
** The SymmetryIndicators 'JaySignal' Indicator **
Combined with the Symmetry Indicators SymmetryDots for Amazing Entries and Exits!
Members Only - Add-On Service with The JaySignal '!!!
Membership Has Its Privledges. Email Jerel@DayTradingTheFutures.com


Symmetry Indicators
For The NinjaTrader Platform
Day Trading the Futures/Symmetry Indicators Risk Disclaimer
Jason Wireman/Day Trading the Futures/Symmetry Indicators or Jason Wireman employees, do not hold themselves out as a Commodity Trading Advisor (CTA). Given this representation, all information and material provided by Jason Wireman or Jason Wireman employees is for educational purposes only and should not be considered specific investment advice.
CFTC RULE 4.41 -HYPOTHETICAL OR SIMULATED PERFORMANCE RESULTS HAVE CERTAIN LIMITATIONS. UNLIKE AN ACTUAL PERFORMANCE RECORD, SIMULATED RESULTS DO NOT REPRESENT ACTUAL TRADING. ALSO, SINCE THE TRADES HAVE NOT BEEN EXECUTED, THE RESULTS MAY HAVE UNDER OR OVER COMPENSATED FOR THE IMPACT, IF ANY OF CERTAIN MARKET FACTORS, SUCH AS LACK OF LIQUIDITY. SIMULATED TRADING PROGRAMS IN GENERAL ARE ALSO SUBJECT TO THE FACT THAT THEY ARE DESIGNED WITH THE BENEFIT OF HINDSIGHT. NO REPRESENTATION IS BEING MADE THAT ANY ACCOUNT WILL OR IS LIKELY TO ACHIEVE PROFIT OR LOSSES SIMILAR TO THOSE SHOWN. PAST PERFORMANCE IS NOT NECESSARILY INDICATIVE OF FUTURE RESULTS.
Commodity Futures Trading Commission Futures and Options trading has large potential rewards, but also large potential risk. You must be aware of the risks and be willing to accept them in order to invest in the futures and options markets. Dont trade with money you cant afford to lose. This is neither a solicitation nor an offer to Buy/Sell futures, stocks or options on the same. No representation is being made that any account will or is likely to achieve profits or losses similar to those discussed on this web site. The past performance of any trading system or methodology is not necessarily indicative of future results.
NO REPRESENTATION IS BEING MADE THAT ANY ACCOUNT WILL, OR IS LIKELY TO ACHIEVE PROFITS OR LOSSES SIMILAR TO THOSE DISCUSSED WITH Jason Wireman/DayTradingtheFutures.com/SymmetryIndicators.com or Jason Wireman employees, SUPPORT AND TEXTS. Jason WIreman's Sotware/Live Room COURSE(S), PRODUCTS AND SERVICES SHOULD BE USED AS LEARNING AIDS ONLY AND SHOULD NOT BE USED TO INVEST REAL MONEY. IF YOU DECIDE TO INVEST REAL MONEY, ALL TRADING DECISIONS SHOULD BE YOUR OWN.
Trading commodities on margin carries a high level of risk, and may not be suitable for all investors. The high degree of leverage can work against you as well as for you. Before deciding to invest in commodities you should carefully consider your investment objectives, level of experience, and risk appetite. The possibility exists that you could sustain a loss of some or all of your initial investment and therefore you should not invest money that you cannot afford to lose. You should be aware of all the risks associated with commodities trading, and seek advice from an independent financial adviser if you have any doubts
Education and information contained from Jason Wireman/DayTradingthefutures.com/SymmetryIndicators.com or Jason Wireman employees, is not an invitation to trade Crude Oil, Gold Futures or any other futures markets. Trading requires risking money in pursuit of future gain. That is your decision. Do not risk any money you cannot afford to lose. This document does not take into account your own individual financial and personal circumstances. It is intended for educational purposes only and NOT as individual investment advice. Do not act on this without advice from your investment professional, who will verify what is suitable for your particular needs & circumstances. Failure to seek detailed professional personally tailored advice prior to acting could lead to you acting contrary to your own best interests & could lead to losses of capital.
Use of any of this information is entirely at your own risk, for which Jason Wireman/Daytradingthefutures.com/SymmetryIndicators or Jason Wireman employees will not be liable. Neither we nor any third parties provide any warranty or guarantee as to the accuracy, timeliness, performance, completeness or suitability of the information and content found or offered in the material for any particular purpose. You acknowledge that such information and materials may contain inaccuracies or errors and we expressly exclude liability for any such inaccuracies or errors to the fullest extent permitted by law. All information/software from Jason Wireman/DayTradingthefutures/SymmetryIndicators or Jason Wireman employees exists, soley and entirely for educational purposes.
*Risk Disclosure / Risk Disclaimer:
There is a risk of loss in futures, Forex and options trading. There is risk of loss trading futures, Forex and options online. Please trade with capital you can afford to lose. Past performance is not necessarily indicative of future results. Nothing in this site is intended to be a recommendation to buy or sell any futures or options market. All information has been obtained from sources, which are believed to be reliable, but accuracy and thoroughness cannot be guaranteed. Readers are solely responsible for how they use the information and for their results. SymmetryIndicators, Inc. and DayTradingTheFutures, Inc and their affiliated websites., do not guarantee the accuracy or completeness of the information or any analysis based thereon. Margins subject to change without notice. Commission Rule 4.41(c)(1) applies to "any publication, distribution or broadcast of any report, letter, circular, memorandum, publication, writing, advertisement or other literature
." Commission Rule 4.41(b) prohibits any person from presenting the performance of any simulated or hypothetical futures account or futures interest of a CTA, unless the presentation is accompanied by a disclosure statement. The statement describes the limitations of simulated or hypothetical futures trading as a guide to the performance that a CTA is likely to achieve in actual trading. Additional Risk Disclosure Statement for System Traders: Commission Rule 4.41(b)(1)(I) hypothetical or simulated performance results have certain inherent limitations. Unlike an actual performance record, simulated results do not represent actual trading. Also, since the trades have not actually been executed, the results may have under- or over-compensated for the impact, if any, of certain market factors, such as lack of liquidity. Simulated trading programs in general are also subject to the fact that they are designed with the benefit of hindsight. No representation is being made that any account will or is likely to achieve profits or losses. There have been no promises, guarantees or warranties suggesting that any trading will result in a profit or will not result in a loss. Hypothetical performance results have many inherent limitations, some of which are described below. No representation is being made that any account will or is likely to achieve profits or losses similar to those shown. In fact, there are frequently sharp differences between hypothetical performance results and the actual results subsequently achieved by any particular trading program. One of the limitations of hypothetical performance results is that they are generally prepared with the benefit of hindsight. In addition, hypothetical trading does not involve financial risk, and no hypothetical trading record can completely account for the impact of financial risk in actual trading. For example, the ability to withstand losses or adhere to a particular trading program in spite of trading losses are material points which can also adversely affect actual trading results. There are numerous other factors related to the markets in general or to the implementation of any specific trading program which cannot be fully account for in the preparation of hypothetical performance results and all of which can adversely affect actual trading results. (CFTC RULE 4.41) CALCULATED OR SUGGESTED ENTRY AND EXIT POINTS CAN PRODUCE HYPOTHETICAL OR SIMULATED PERFORMANCE RESULTS WHICH HAVE CERTAIN INHERENT LIMITATIONS UNLIKE ACTUAL PERFORMANCE RECORD: SIMULATED RESULTS DO NOT REPRESENT ACTUAL TRADING. ALSO, SINCE THE TRADES HAVE NOT ACTUALLY BEEN EXECUTED, THE RESULTS MAY HAVE UNDER- OR OVERCOMPENSATED FOR THE IMPACT, IF ANY, OF CERTAIN MARKET FACTORS, SUCH AS LACK OF LIQUIDITY. SIMULATED TRADING PROGRAMS IN GENERAL ARE ALSO SUBJECT TO THE FACT THAT THEY ARE DESIGNED WITH THE BENEFIT OF HINDSIGHT. NO PRESENTATION IS BEING MADE THAT ANY ACCOUNT WILL, OR IS LIKELY TO ACHIEVE, PROFITS OR LOSSES SIMILAR TO THOSE PREDICTED OR SHOWN. HYPOTHETICAL OR SIMULATED PERFORMANCE RESULTS HAVE CERTAIN LIMITATIONS. UNLIKE AN ACTUAL PERFORMANCE RECORD, SIMULATED RESULTS DO NOT REPRESENT ACTUAL TRADING. ALSO, SINCE THE TRADES HAVE NOT BEEN EXECUTED, THE RESULTS MAY HAVE UNDER OR OVER COMPENSATED FOR THE IMPACT, IF ANY, OF CERTAIN MARKET FACTORS, SUCH AS LACK OF LIQUIDITY. SIMULATED TRADING PROGRAMS IN GENERAL ARE ALSO SUBJECT TO THE FACT THAT THEY ARE DESIGNED WITH THE BENEFIT OF HINDSIGHT. NO REPRESENTATION IS BEING MADE THAT ANY ACCOUNT WILL OR IS LIKELY TO ACHIEVE PROFITS OR LOSSES SIMILAR TO THOSE SHOWN. SIMULATED RESULTS DO NOT NECESSARILY IMPLY FUTURE PROFITS. THE RISK OF LOSS IN TRADING FOREX OR COMMODITY CONTRACTS CAN BE SUBSTANTIAL. YOU SHOULD THEREFORE CAREFULLY CONSIDER WHETHER SUCH TRADING IS SUITABLE FOR YOU IN LIGHT OF YOUR FINANCIAL CONDITION. HYPOTHETICAL PERFORMANCE RESULTS HAVE MANY INHERENT LIMITATIONS, SOME OF WHICH ARE DESCRIBED BELOW. NO REPRESENTATION IS BEING MADE THAT ANY ACCOUNT WILL OR IS LIKELY TO ACHIEVE PROFITS OR LOSSES SIMILAR TO THOSE SHOWN. IN FACT, THERE ARE FREQUENTLY SHARP DIFFERENCES BETWEEN HYPOTHETICAL PERFORMANCE RESULTS AND THE ACTUAL RESULTS SUBSEQUENTLY ACHIEVED BY ANY PARTICULAR TRADING PROGRAM. ONE OF THE LIMITATIONS OF HYPOTHETICAL PERFORMANCE RESULTS IS THAT THEY ARE GENERALLY PREPARED WITH THE BENEFIT OF HINDSIGHT. IN ADDITION, HYPOTHETICAL TRADING DOES NOT INVOLVE FINANCIAL RISK AND NO HYPOTHETICAL TRADING RECORD CAN COMPLETELY ACCOUNT FOR THE IMPACT OF FINANCIAL RISK IN ACTUAL TRADING. FOR EXAMPLE, THE ABILITY TO WITHSTAND LOSSES OR ADHERE TO A PARTICULAR TRADING PROGRAM IN SPITE OF TRADING LOSSES ARE MATERIAL POINTS WHICH CAN ALSO ADVERSELY AFFECT ACTUAL TRADING RESULTS. THERE ARE NUMEROUS OTHER FACTORS RELATED TO THE MARKETS IN GENERAL OR TO THE IMPLEMENTATION OF ANY SPECIFIC TRADING PROGRAM WHICH CANNOT BE FULLY ACCOUNTED FOR IN THE PREPARATION OF HYPOTHETICAL PERFORMANCE RESULTS AND ALL OF WHICH CAN ADVERSELY AFFECT ACTUAL TRADING RESULTS.
www.SymmetryIndicators.com
Copyright © 2014 SymmetryIndicators - All Rights Reserved
¤ NinjaTrader Add Ons for performance ¤ NinjaTrader Indicators
¤Register and Download The NinjaTrader Platform - Symmetry Indicators' preferred platform
NinjaTrader is free without limit for Live simulator trading, education, strategy or Indicator development. Real Time data is also provided free.
- NinjaTrader is unique in the trading industry in that we provide an end-to-end trading platform for futures, forex and equities traders that is free to use for advanced charting, market analytics, trading system development and trade simulation using our state of the art trade simulator.
- Online registration - Free Software, realtime and historical data - FOREX ECN and Futures - No funds required - No risk - No large forms to fill in.
- Download - NinjaTrader configure and connect to start trading in minutes - with live market data!!!.
Symmetry Indicators is a NinjaTrader Partner - NinjaTrader Indicators for performance
- As an active trader, the trading tools you select will have a dramatic impact on your success. Whether you trade futures, forex or equities, you can significantly enhance your trading efficiency through NinjaTraders powerful array of analytic tools, innovative trade management features and industry proven order execution capabilities.
**** Below is one of our 'LIVE' Day Trade rooms setups. Come into our Trade rooms for a **** FREE 3 day trial to see the 3 other main setups we use and trade daily.
Would you like to Day Trade with Leading Indicators instead of lagging indicators in the Futures, Forex & Stock Markets.
Symmetry Indicators 'JaySignal ' Just released with the Custom Bar Type ' SymRenko '.
- Symmetry Indicators JaySignal Pin Points Trades In all Markets: CLICK TO SEE SCREENSHOT. CLICK TO WATCH SHORT VIDEO.
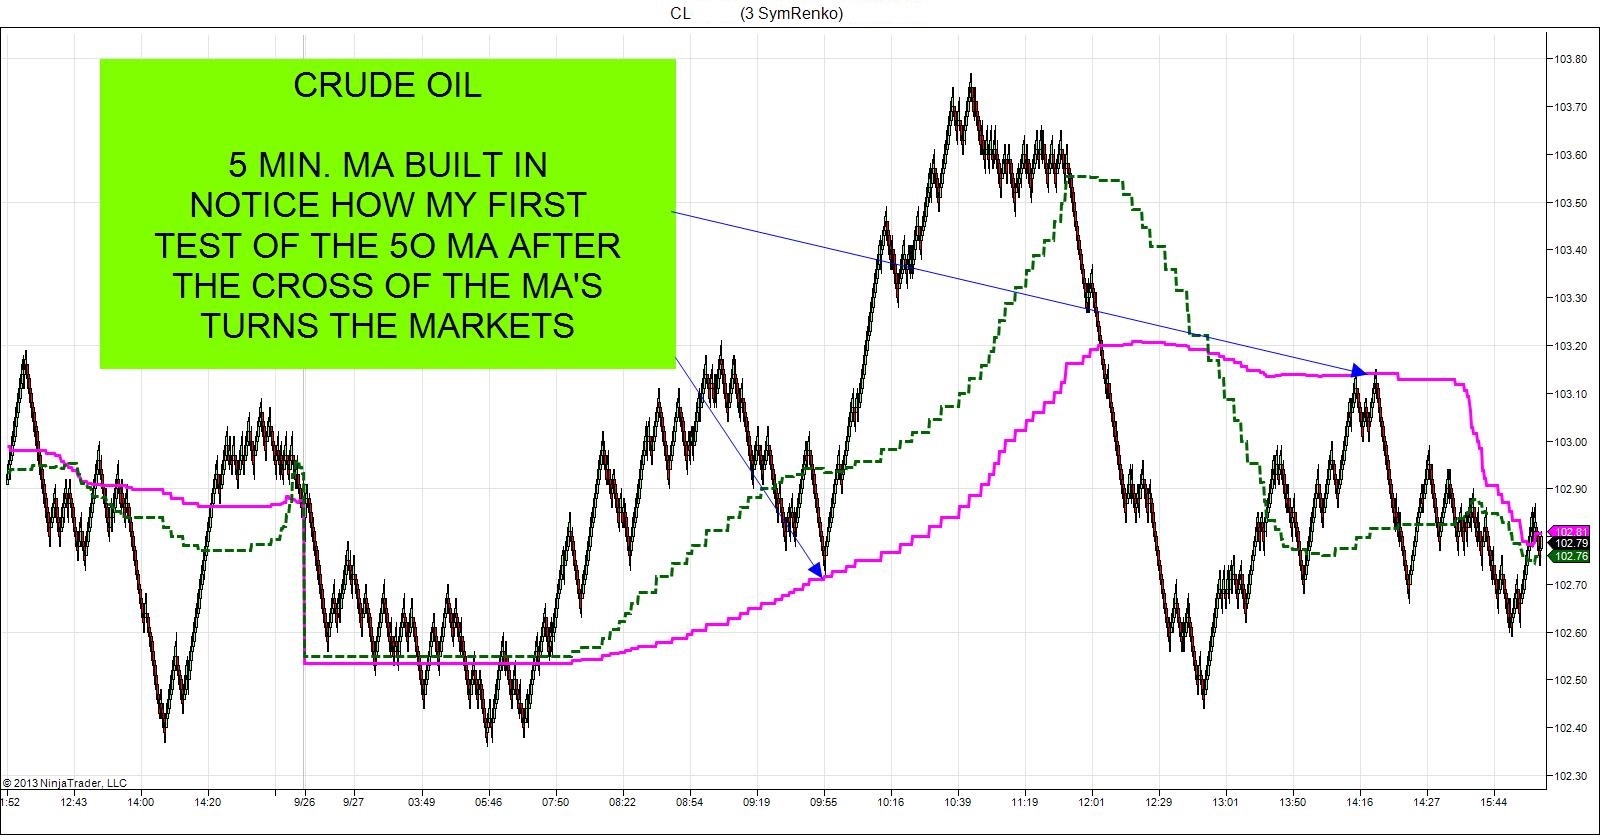
- Symmetry Indicators SymmetryDots allows you to focus on possible Tops and Bottoms far in advance. Also, the Symmetry Indicators SymmetryDots will allow you to focus on buying higher lows and shorting lower highs with the symmetry of the market. This allows you to catch the big moves and trail your positions with small stops and not counter trend trade. For example, if the market that you are trading is setting higher lows with dots then you want to buy pullbacks to the buy dots. If the market is setting lower highs then you want to short rallys into the sell dots. When the trend is about to change the dots will then call the highs and lows on a very consistent basis.
DAY TRADING WITH THE SYMMETRY OF THE MARKET
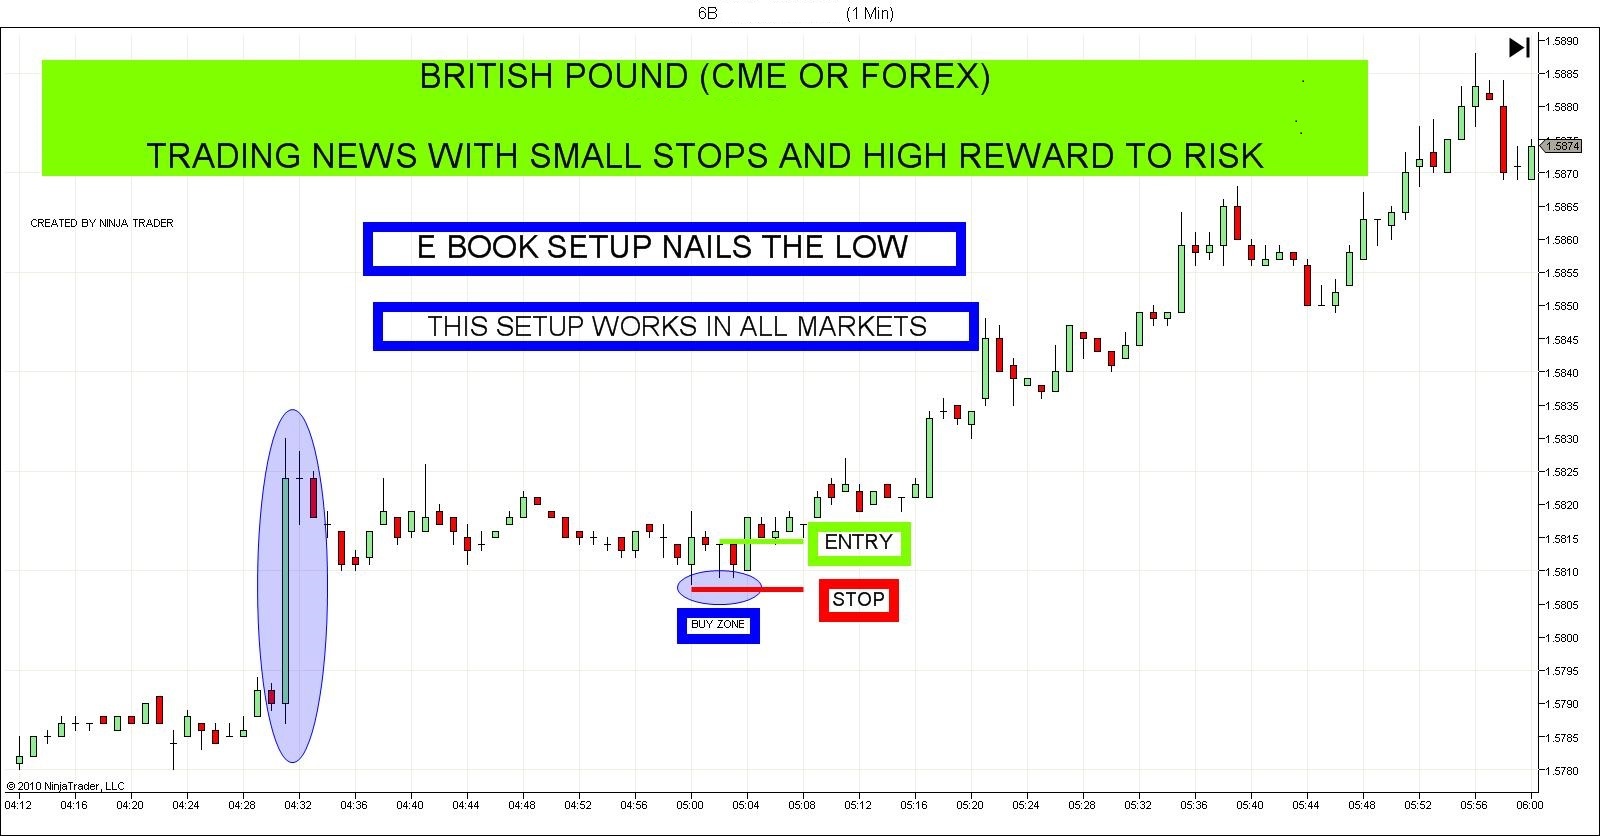
- E-book Released! Powerful institutional setup, right at the open, everday in every market. News or no news. Be done in the first hour of trading. We give you the specific setup to the exact tick/pip. See the videos, how we nail it and start trading this Institutional Setup today.
*** E-Book *** Released *** Explosive moves within minutes Day Trading Our Institutional Zones! Click Here
3 Day 'FREE' Trial in 'Live' Day Trading Rooms. Click Here
Come in and watch our 'Top Setups' and how we trade the 'Crude Oil' and 'Gold Futures' 23 out of 24 hours a day. See how our recent member did 370 ticks in his first week, another trader did 541 ticks trading just one of Jay's setups. See another member winning160 ticks for the day, other traders 50 tick trades, just another day! Thnx for coming to work! Click here to read his statement.
Forex Calendar compliments of ForexPros.com
**** Below are a few of Jay's 'LIVE' E-Book 'Day Trading Price Action' trade setups'. 'Discover the best kept secret in the Forex and Futures markets, 'Trade the News!' **** FREE 3 day trial to see the 3 other main setups we use and trade daily.

Symmetry Indicators For The NinjaTrader Platform


Day Trading the Futures & Forex markets minutes after the News to the EXACT BAR!
Day Trading Futures and Forex News Releases. Euro Non Farm Report 2-4-11
An online website specializing in, Crude Oil and Gold Futures Trading.
- Symmetry Indicators SymmetryDots = Leading Indicator Trailing Profits and Exits!
Leading Indicators That Work On Futures / Forex / Stocks!
Inquire About Our OtherSymmetry Indicators Available.
- Symmetry Indicators JaySignal = Signals Tops / Bottoms and Amazing Entries!
Click On Image
Contact: Jay & Jerel at SymmetryIndicators@hotmail.com


***** ' Rated As The Top 5 Futures Day Trading Room Out Of 337 Live Rooms' *****
Click On Image


Real Time Economic Calendar provided by Investing.com.
Symmetry Indicators

Click On Image
FUTURES MARKETS MOVE IN MY OPINION STRICTLY DUE TO SUPPLY AND DEMAND IMBALANCES!

Revolutionary New Fibonacci Confluence Indicator!